Setting up a monitoring with prometheus and grafana
Date: 2024-01-10
Category: Tutorial
Monitoring servers is a crucial element in ensuring smooth operation. In this guide I will be setting up monitoring using Prometheus and a dashboard with Grafana.
 Requirements
- A server to use for monitoring, this will house prometheus and grafana
- A few other servers to monitor.
I will be using Debian based systems in this example:
Setting up node_exporter
To collect the statistics of our target systems, we will use node_exporter. Node exporter publishes key metrics on a web url, which will be scraped on regular intervals by Prometheus.
To install node_exporter on a debian system you can install the prometheus-node-exporter package on the target systems.
# on target hosts
sudo apt install prometheus-node-exporter
Once this is installed, we can continue on the host that will run prometheus/grafana.
Prometheus and Grafana
Installing Prometheus
Prometheus is available as a package on debian, so we can install it with:
sudo apt install prometheusnext, edit /etc/prometheus/prometheus.yml and replace the contents with the following:
global:
  scrape_interval: 15s
  scrape_timeout: 10s
  evaluation_interval: 15s
  external_labels:
    monitor: example
scrape_configs:
- job_name: prometheus
  honor_timestamps: true
  scrape_interval: 5s
  scrape_timeout: 5s
  metrics_path: /metrics
  scheme: http
  follow_redirects: true
  enable_http2: true
  static_configs:
  - targets:
    - monitoring-srv1.local:9100
    - monitoring-srv2.local:9100
now, restart prometheus
sudo service prometheus restartWe can check if the configuration is applied correctly by browing to the prometheus web interface: http://<ip>:9090/classic/targets
Installing Grafana
Grafana is not available in the Debian repositories, so we will have to add the repository ourself:
sudo apt-get install -y apt-transport-https software-properties-common wget
sudo mkdir -p /etc/apt/keyrings/
wget -q -O - https://apt.grafana.com/gpg.key | gpg --dearmor | sudo tee /etc/apt/keyrings/grafana.gpg > /dev/null
echo "deb [signed-by=/etc/apt/keyrings/grafana.gpg] https://apt.grafana.com stable main" | sudo tee -a /etc/apt/sources.list.d/grafana.list
sudo apt-get update
sudo apt install grafana -y
sudo systemctl enable grafana-server --now
Next, open a browser and go to <ip>:3000. You can log in with admin as the username and password.
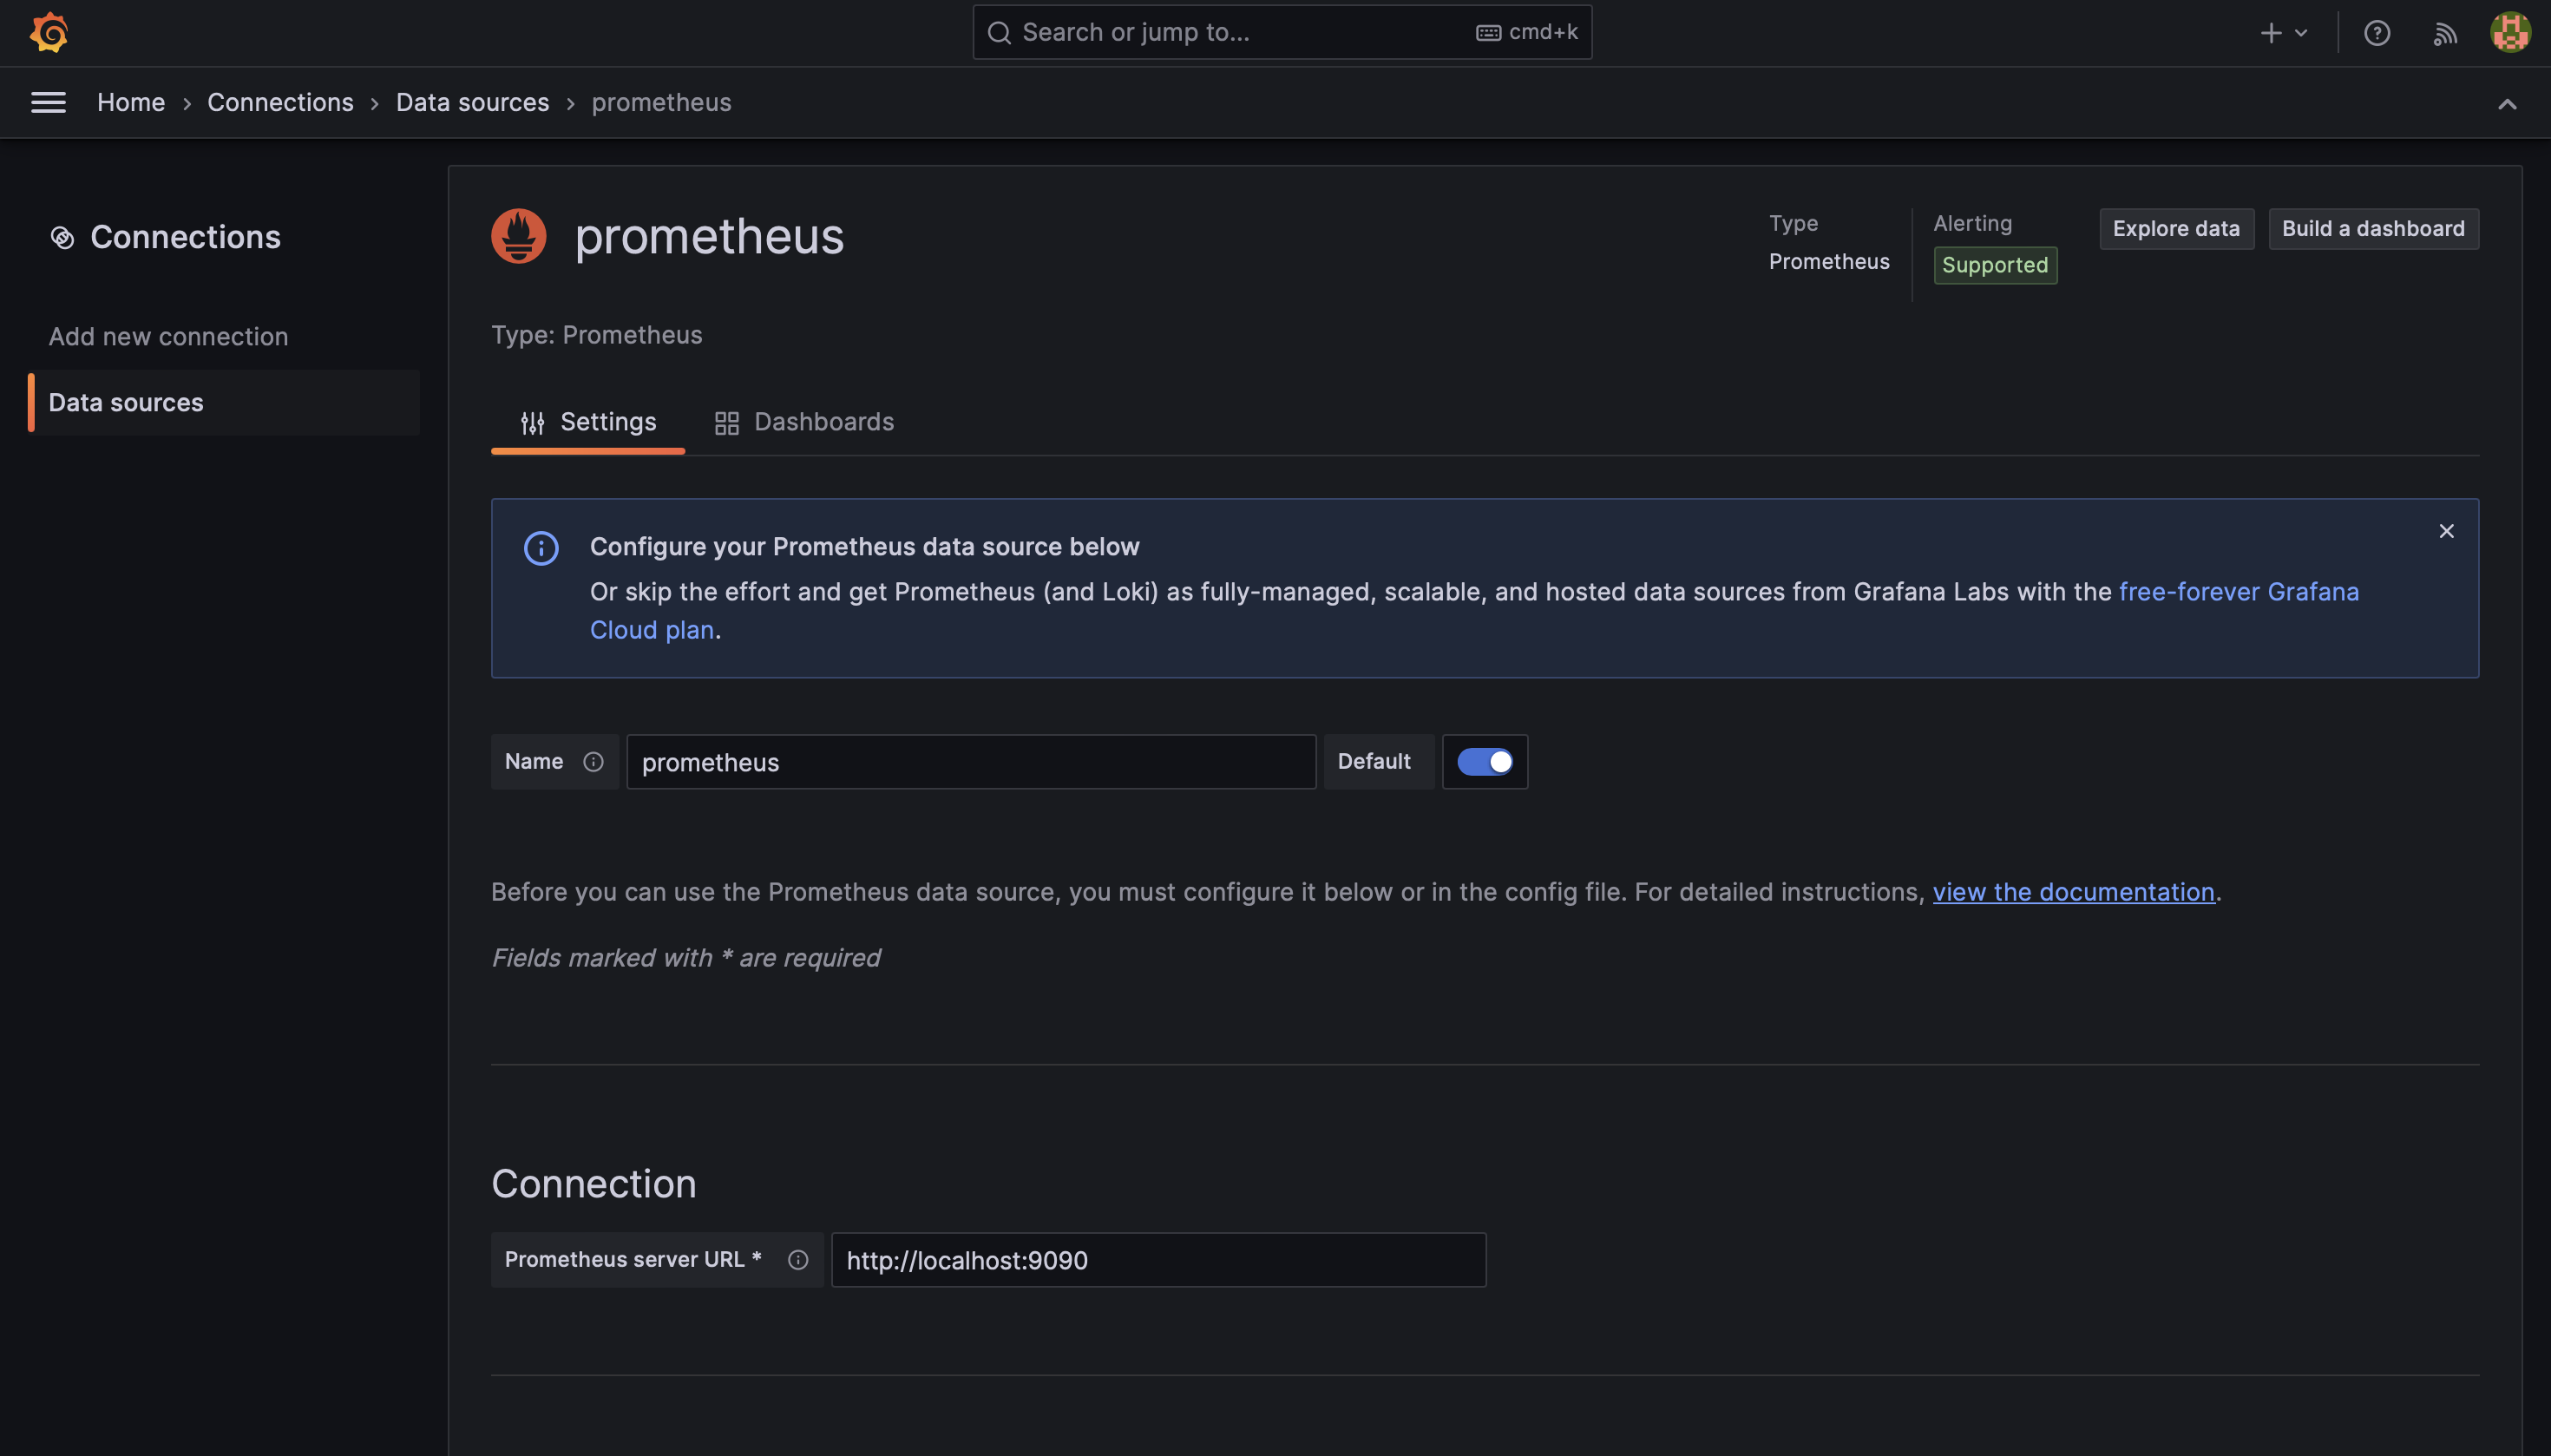
Once logged in, click "Add your first datasource", select "prometheus", and enter the http://localhost:9090 as the URL to prometheus
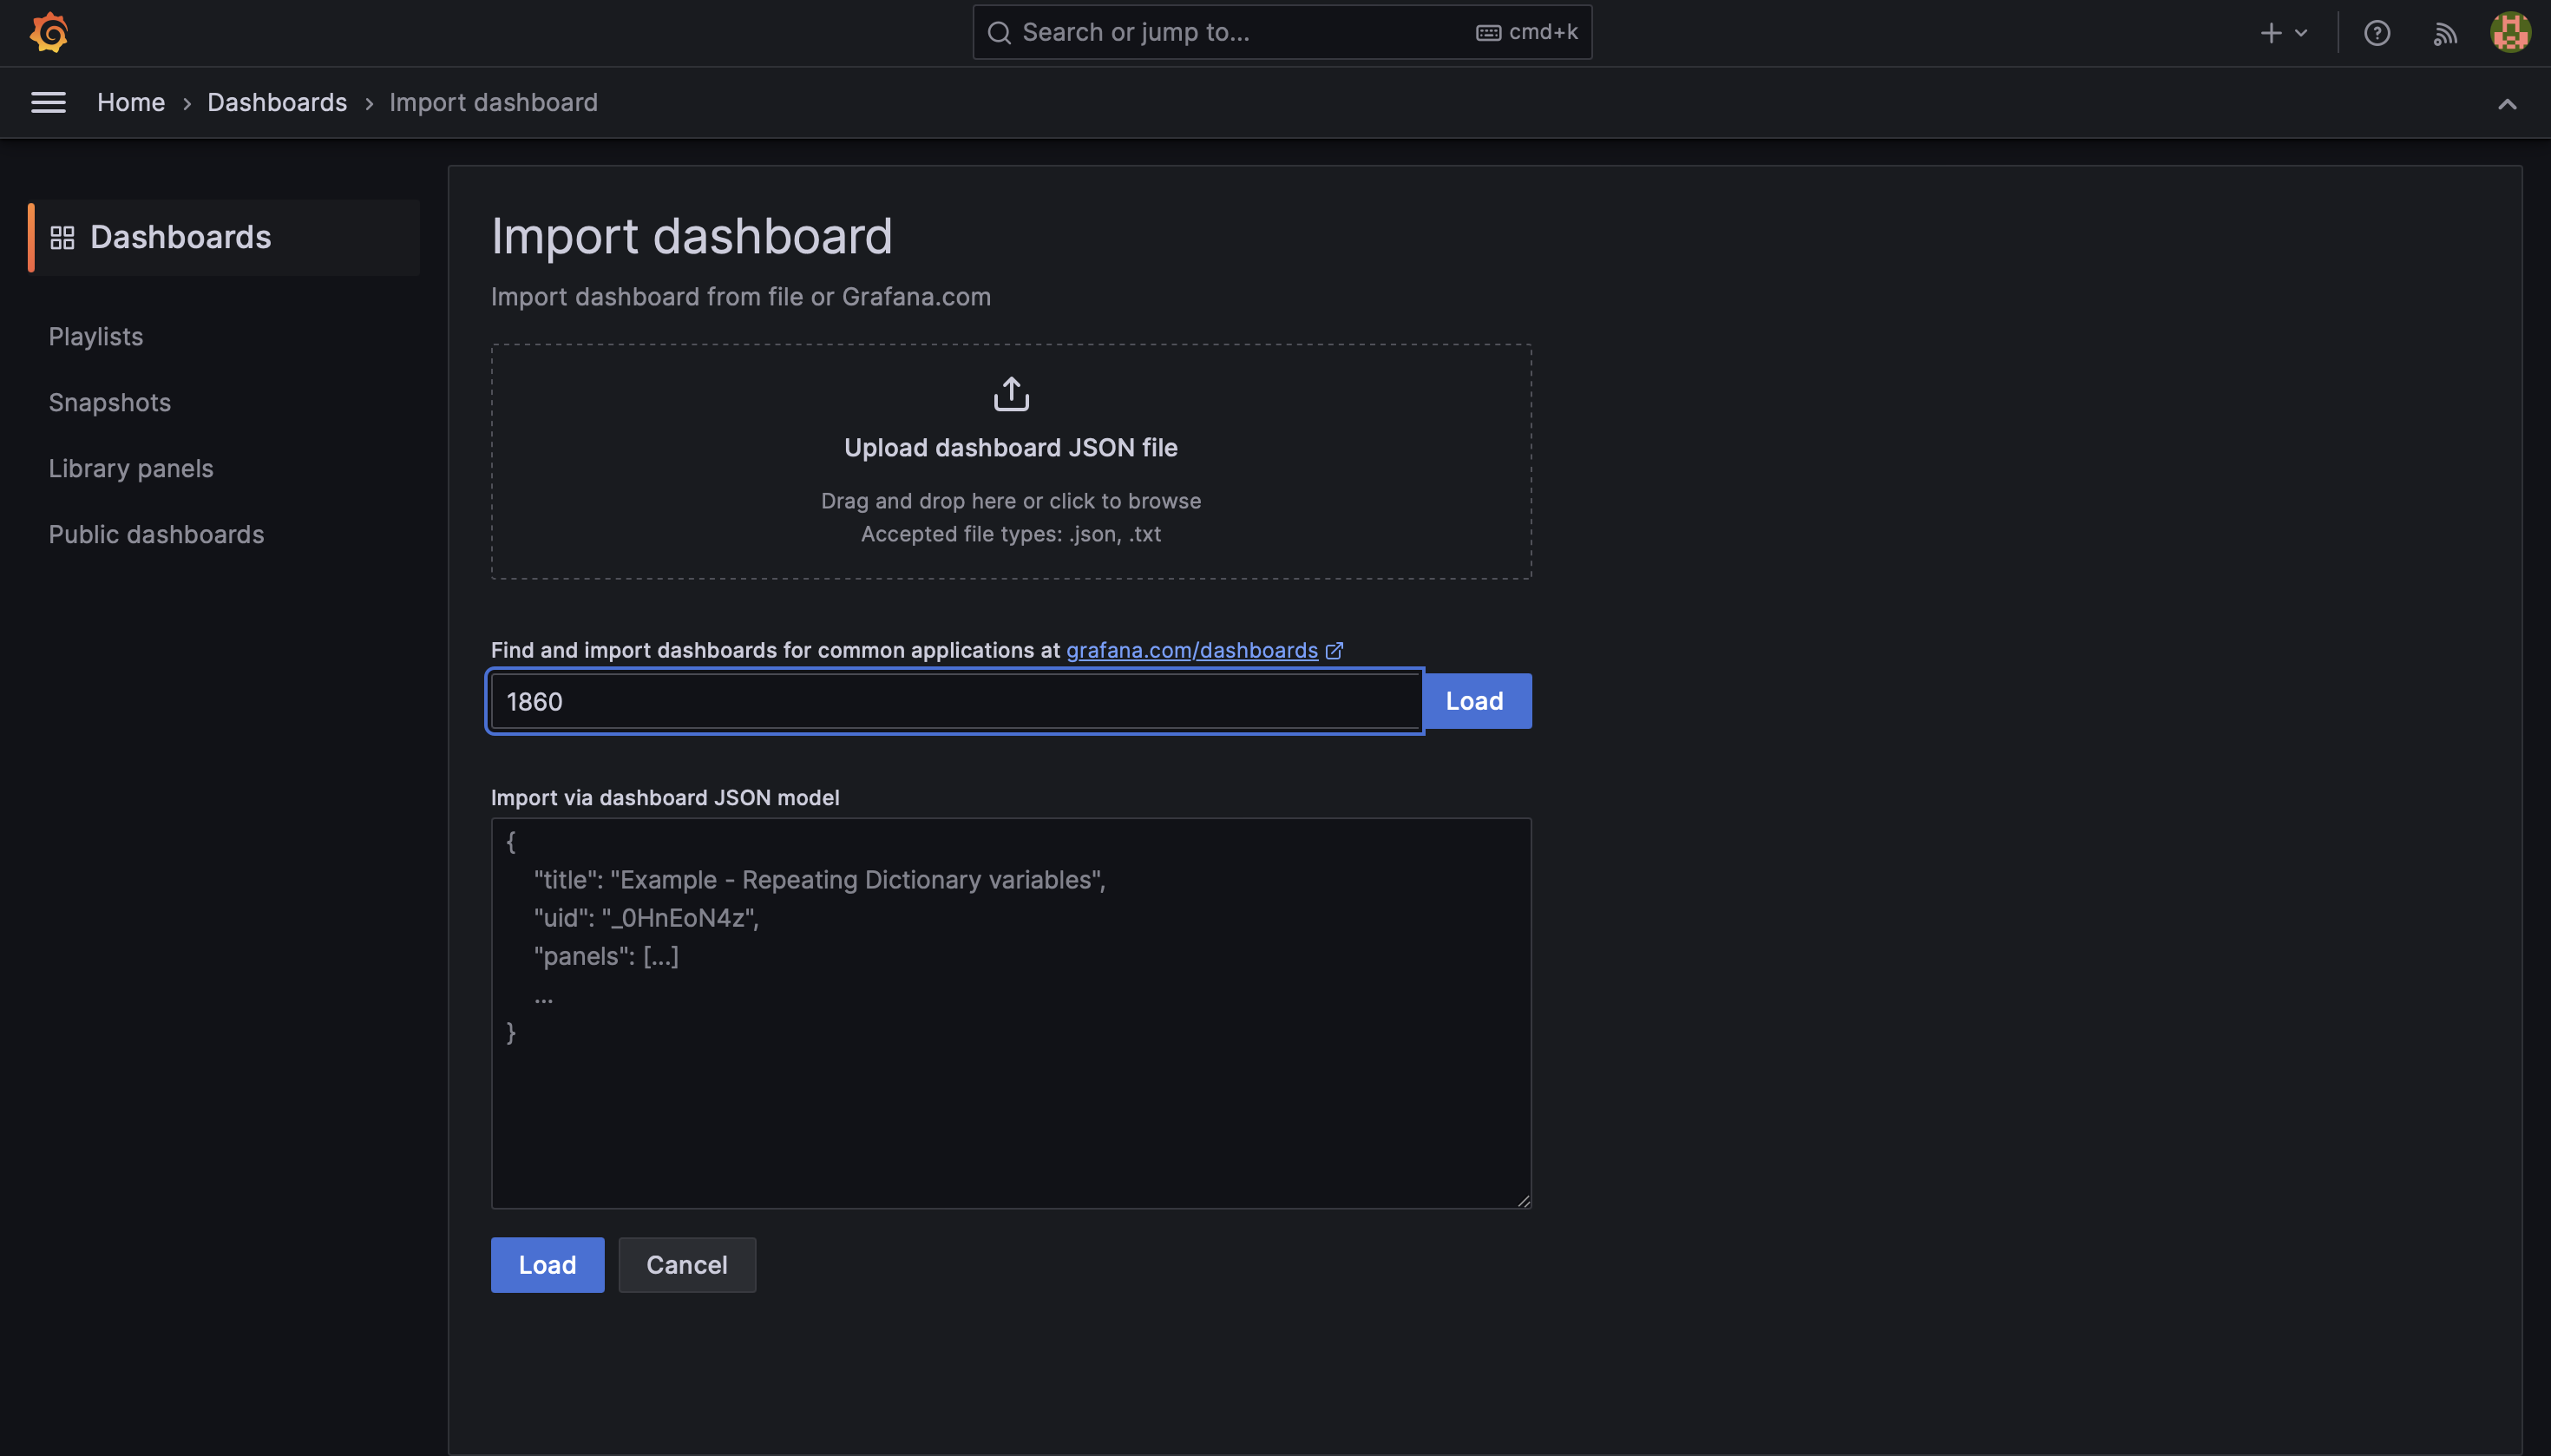
 Next, go back to the home screen, and click "Add your first dashboard", click on "import dashboard" and enter
 1860 as the ID, and click "load"
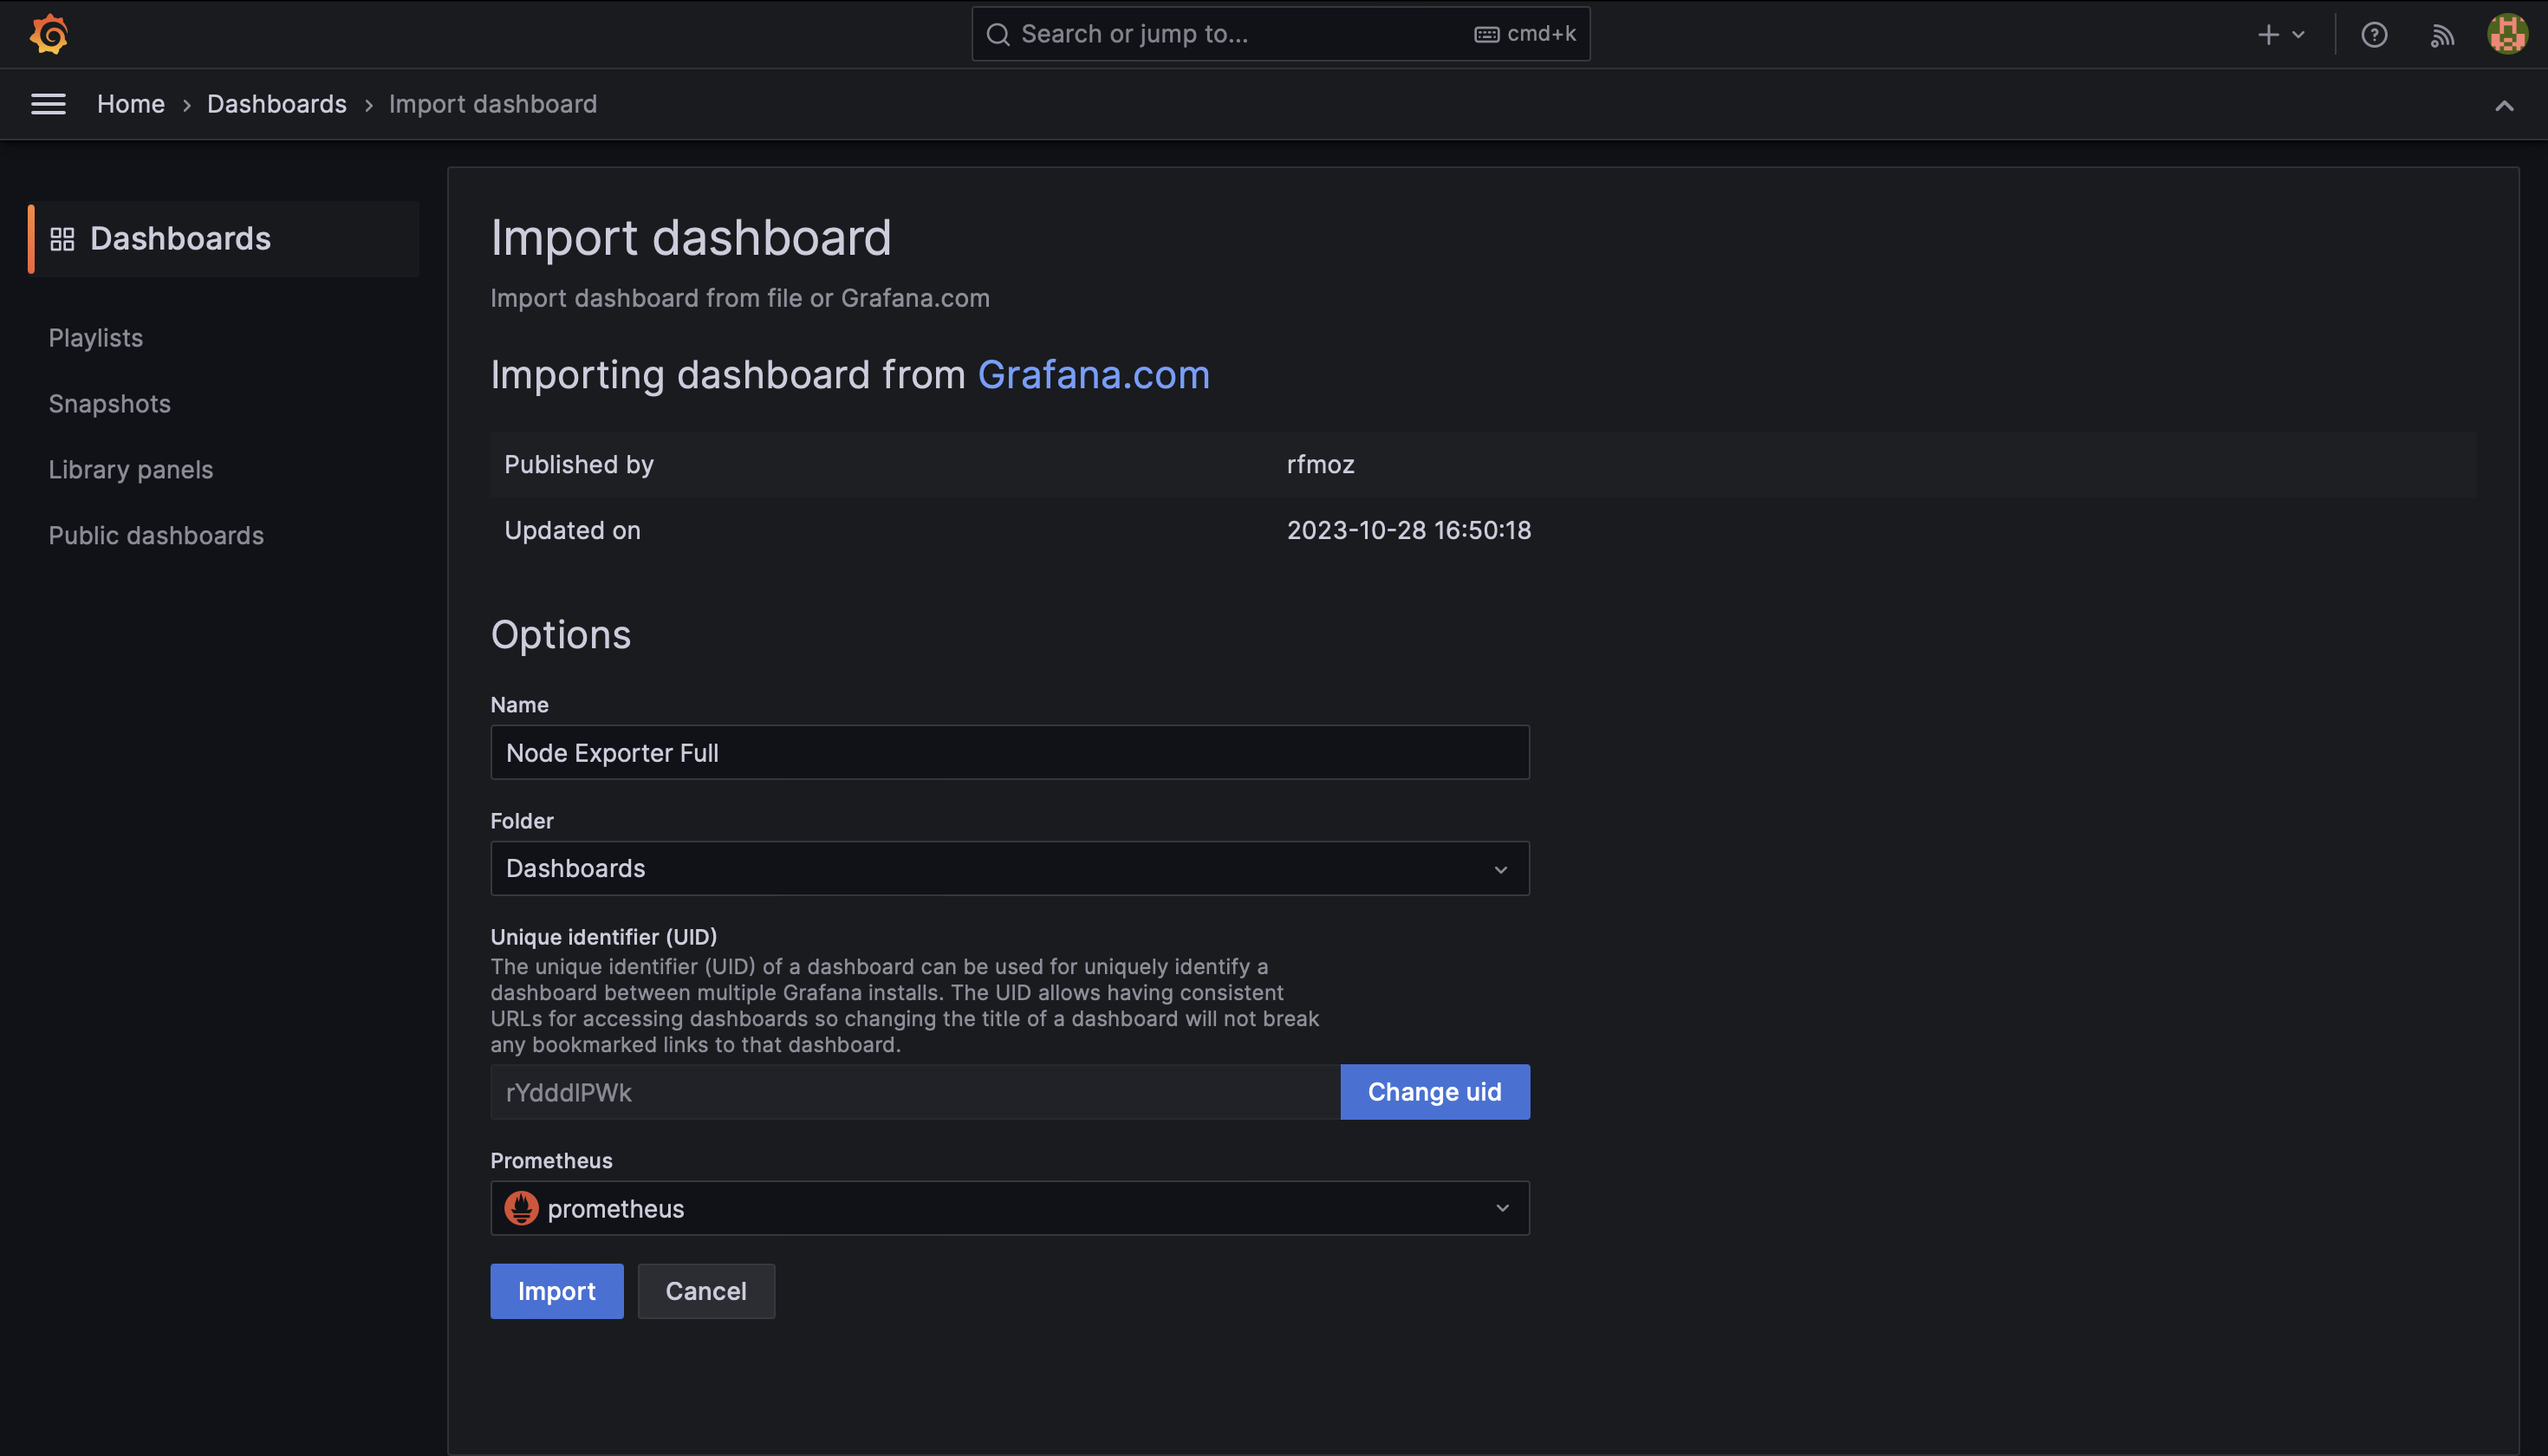
 Next, select the datasource we created earlyer, and click "import"
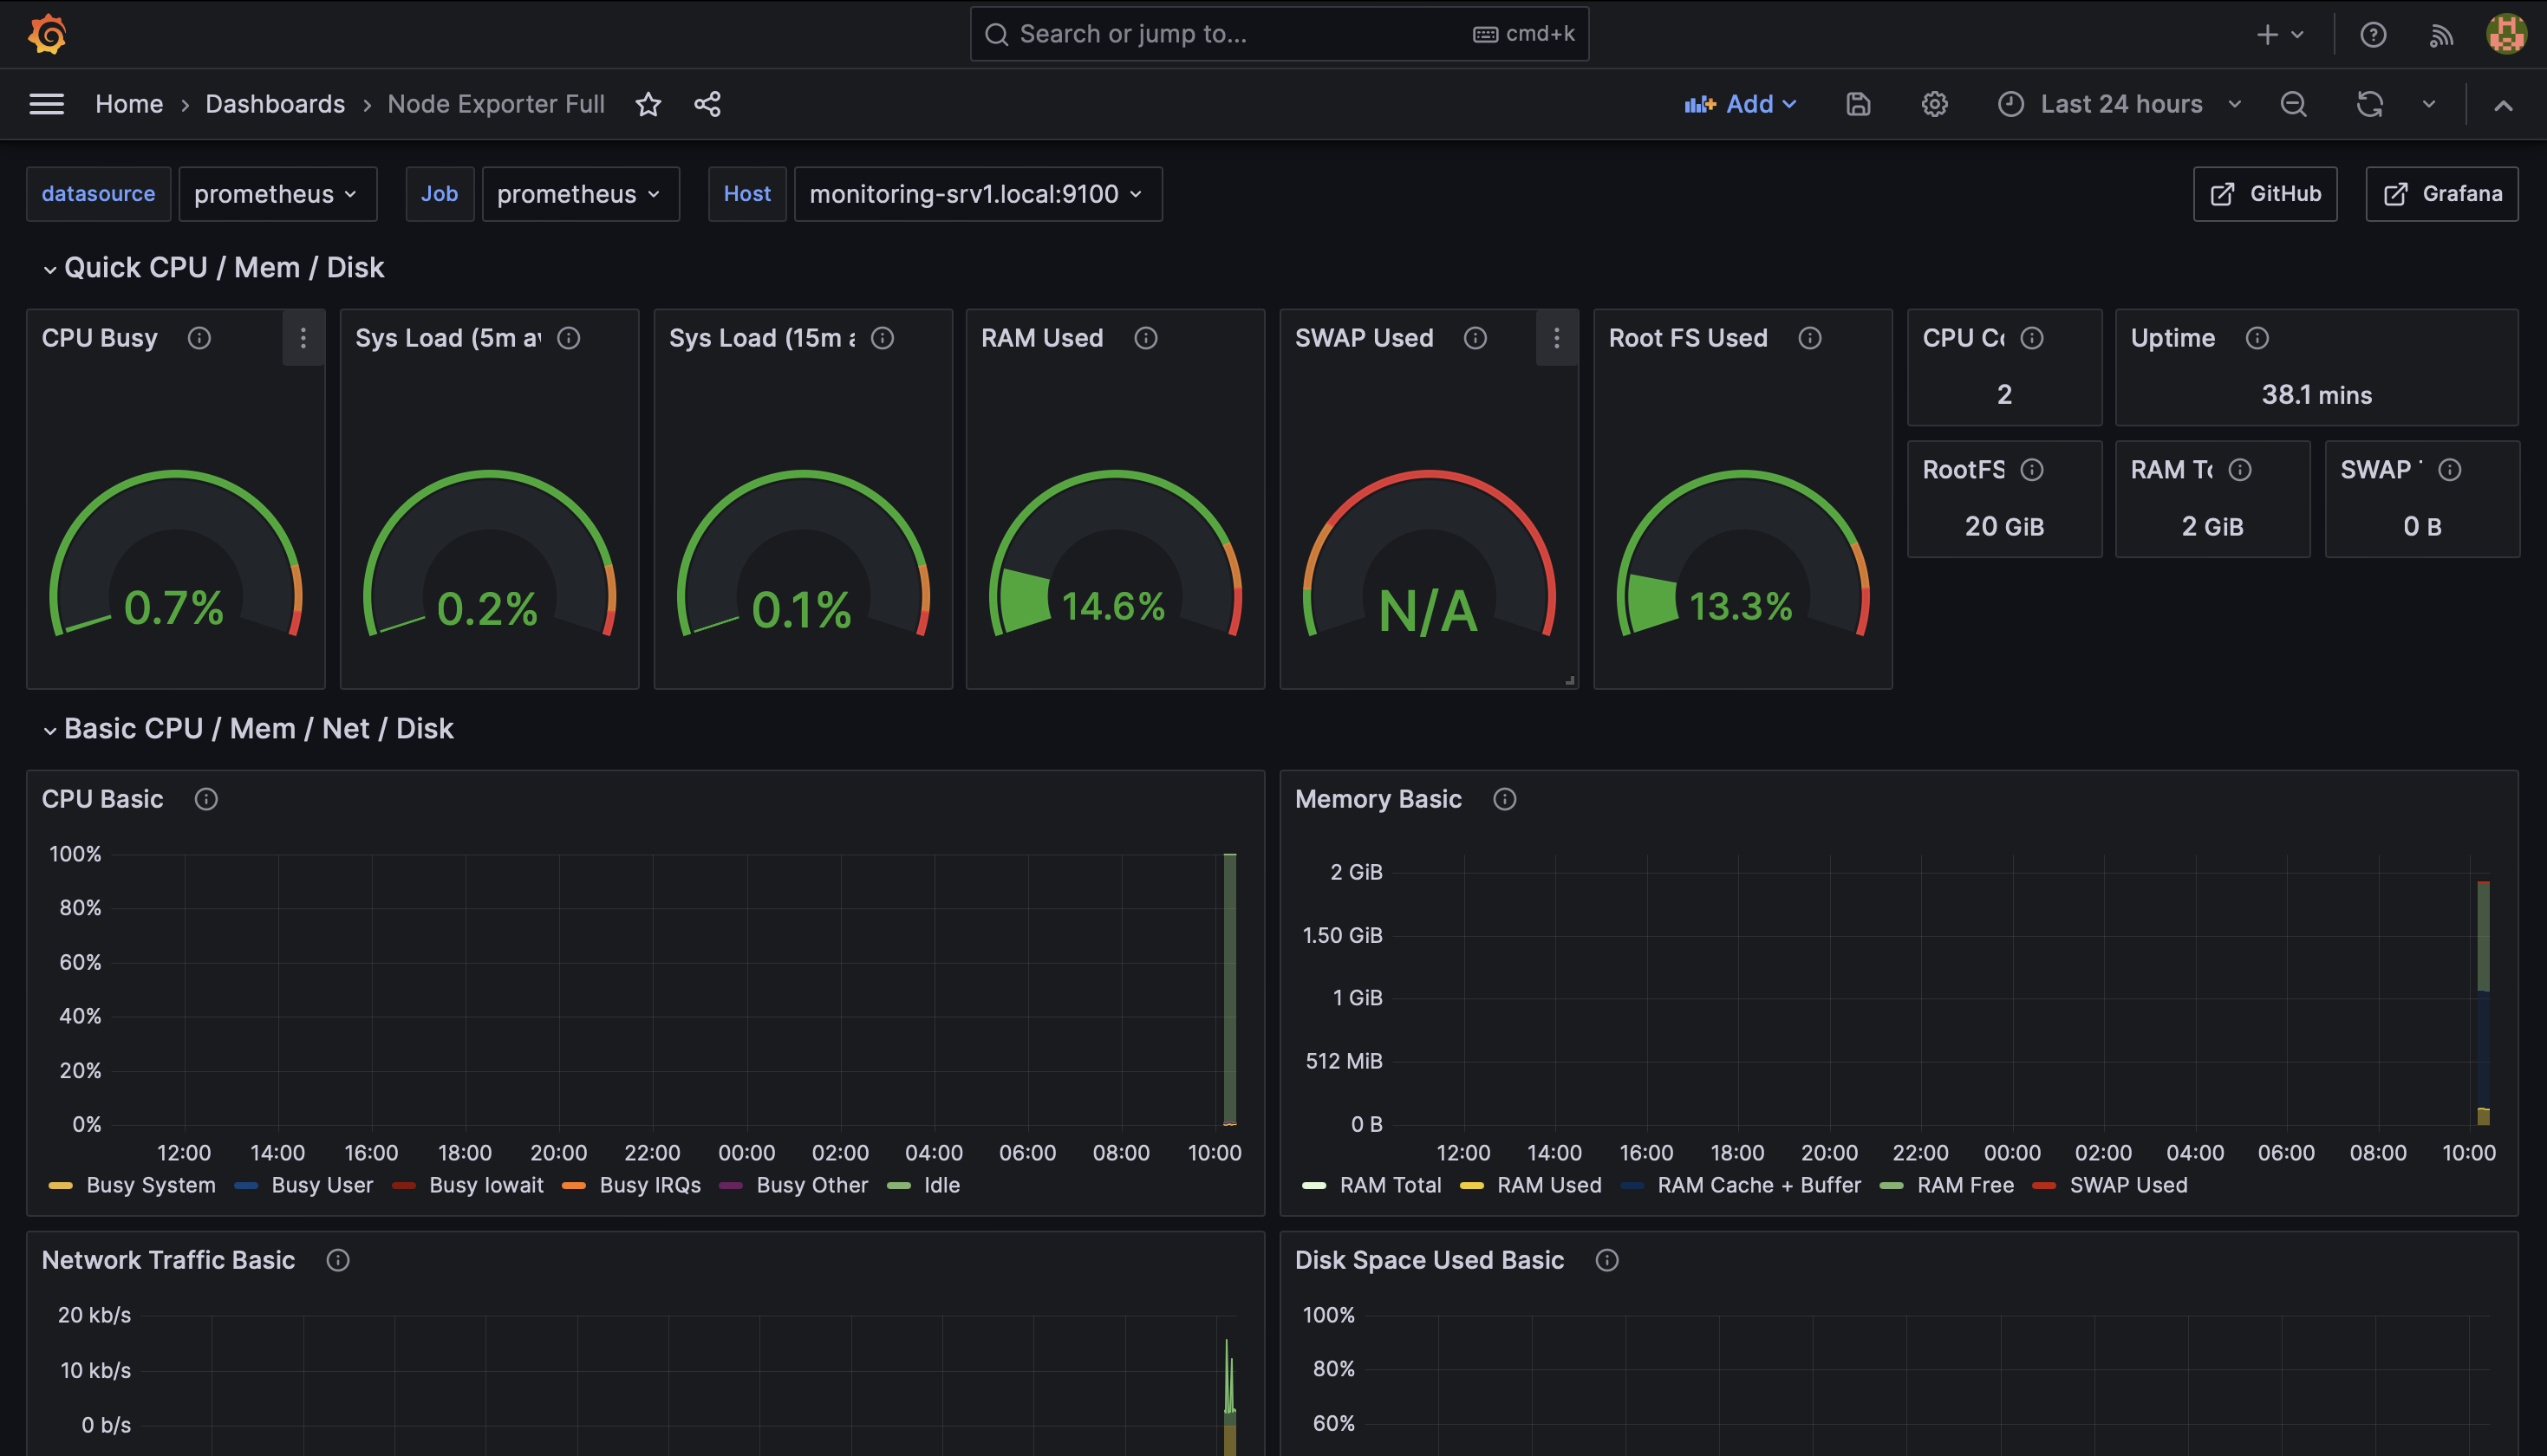
 And that's it! you might need to select "prometheus" in the top left "job" dropdown, and enlarge the top row resource meters, but after that you'll have a working monitoring dashboard!
